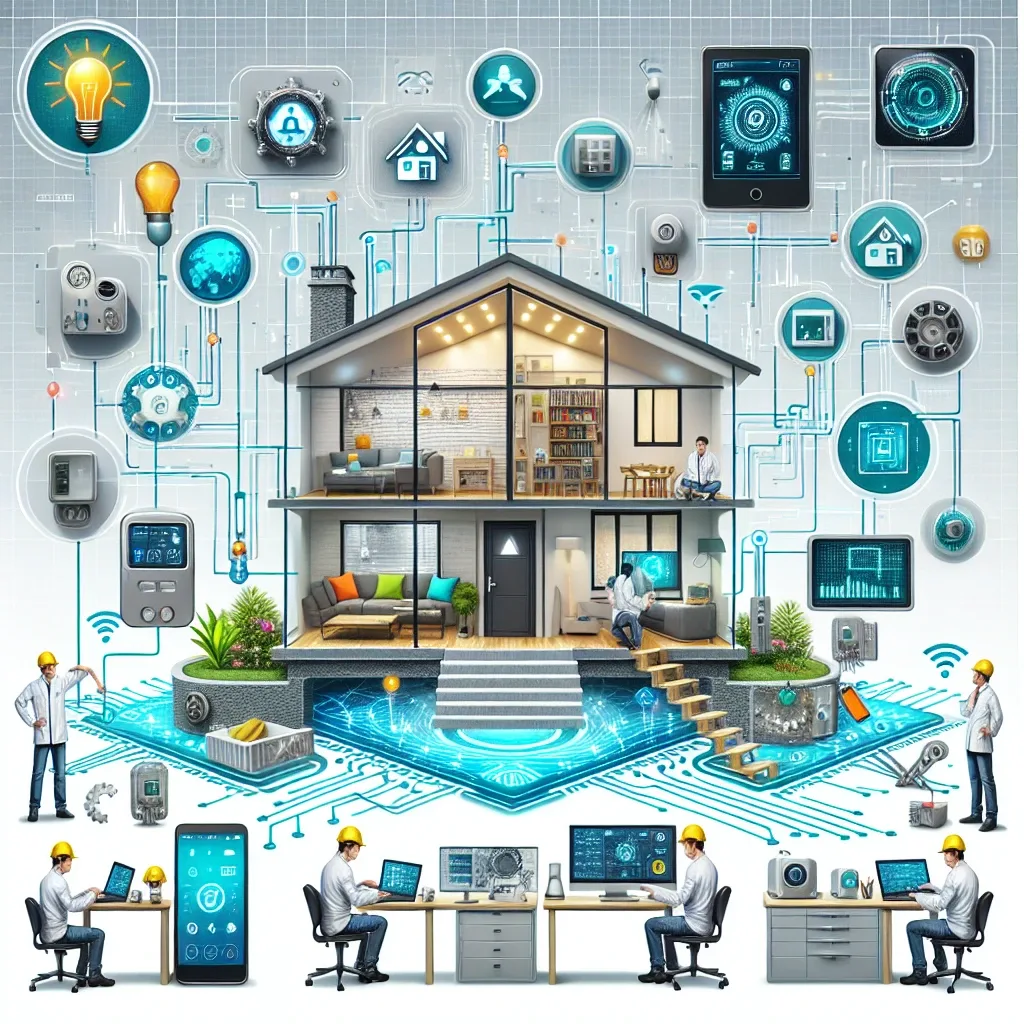
Smart Home development with IoT frequently fails due to poor planning, incompatible devices, or starting with systems too complex for beginners. This guide walks you through the entire process step by step.
Step 1: Build a Robust Network Foundation
A smart home requires Wi-Fi coverage in every corner, meaning investment in quality mesh networking. TP-Link Deco XE75 at 5,000-8,000 THB (3-node set) covers 300 m² with Wi-Fi 6E. Ubiquiti UniFi at 8,000-15,000 THB suits homes requiring enterprise-grade reliability.
Beyond Wi-Fi, a Zigbee Coordinator handles battery-powered sensors. The Sonoff Zigbee 3.0 USB Dongle Plus at 400-600 THB connects via USB to Raspberry Pi 5, supporting hundreds of Zigbee devices simultaneously.
Step 2: Choose the Right Hub
Home Assistant on Raspberry Pi 5 at 3,500-5,500 THB is the best choice for flexibility — supporting over 3,200 device brands through 4,000+ integrations, operating locally without cloud dependency, and keeping personal data private.
For those preferring simplicity, HA Yellow at 4,500-6,500 THB is hardware designed specifically for Home Assistant with built-in Zigbee and Thread. SmartThings Hub at 4,000-8,000 THB suits users in the Samsung ecosystem.
Step 3: Install the Sensor Network
Sensors are the eyes and nose of a Smart Home. Install: CO2 NDIR (Sensirion SCD40 or Aqara TVOC) plus temperature/humidity in every bedroom; PM2.5, CO2, and VOC in the living room; CO, gas sensor, VOC, and humidity in the kitchen; PIR motion and door/window contact sensors at all entry points.
Step 4: Create Automation Rules
Essential automations for health and safety include: PM2.5 above 50 → purifier Speed 3; CO2 above 900 → activate ventilation and LINE notification; CO above 50 ppm → activate all fans, shut off stove, send LINE emergency alert; humidity above 65% → activate dehumidifier; no occupancy for 30 minutes → reduce AC by 2°C and turn off all lights.
Step 5: Measure Results and Improve
Use a Grafana Dashboard connected to InfluxDB to visualize 7-30 day air quality trends. This reveals patterns: PM2.5 peaking every evening from traffic, CO2 accumulating late at night during sleep, humidity spiking after showers. This data enables automation refinement for greater precision and energy efficiency.