The Scale of Air Quality Challenges in 2025
The World Health Organization reports that air pollution causes over 7 million deaths annually — more than AIDS, tuberculosis, and malaria combined. PM2.5 is the leading culprit, penetrating deeper into the body than any other common pollutant. This scale demands intelligent monitoring and management systems across homes, cities, and industrial facilities.
The Four Layers of an IoT Air Quality System
A complete IoT air quality system operates across four layers. The sensor layer measures PM2.5, PM10, toxic gases (CO, NO2, SO2), and oxygen levels at key locations. The AI analytics layer forecasts pollutant levels 1–6 hours ahead and issues targeted alerts. The response layer includes smart purifiers and ventilation systems that activate automatically. The dashboard layer displays real-time data at both household and city scale for informed decision-making.
IoT at the Smart City Level
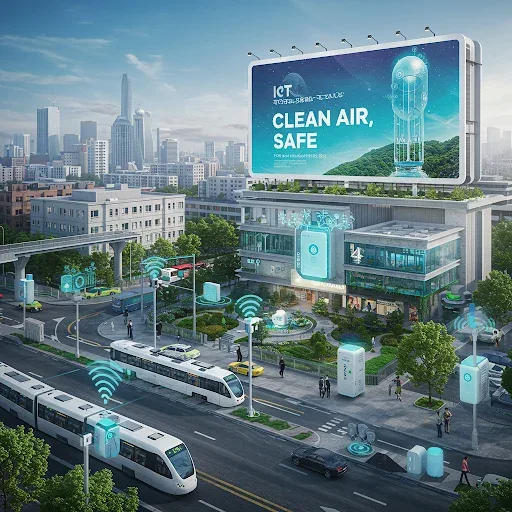
City-wide air quality management leverages IoT in multiple dimensions. Sensor networks at intersections, parks, and industrial zones give municipal authorities real-time pollution mapping. Smart traffic management reduces peak-hour congestion — the period of highest vehicle emissions. Green space planning informed by pollution data creates buffer zones that capture airborne particles. Public alert systems through apps and digital signage allow residents to adjust behavior immediately when thresholds are exceeded.
IoT in Industrial Settings
Factories deploy IoT to monitor emissions against regulatory thresholds, optimize energy use and reduce process inefficiency, detect toxic gas leaks before dangerous concentrations accumulate, and automatically generate compliance reports for regulatory authorities. This reduces both environmental impact and the administrative cost of regulatory compliance substantially.
Benefits and Future Directions
Key outcomes from a fully integrated IoT approach include measurable reductions in population health risk, proactive environmental management replacing reactive incident response, and energy savings from activating filtration only when air quality warrants it. The next generation of IoT air quality systems will integrate 5G for ultra-low latency, drones for monitoring hard-to-reach zones, and cross-city Big Data analytics that predict pollution events across borders before they arrive.