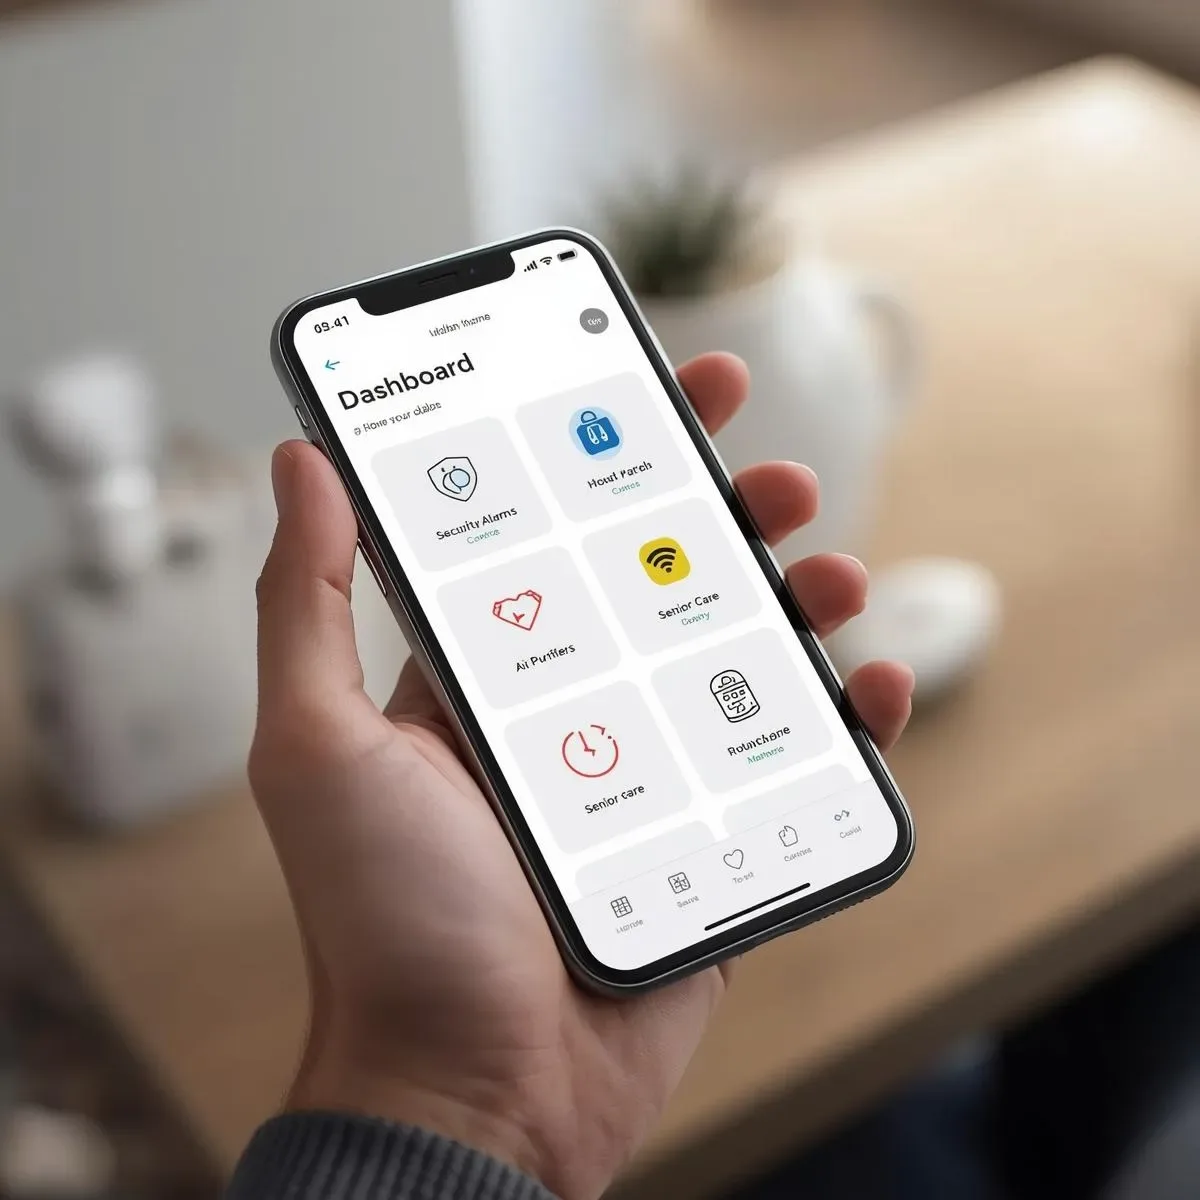
Why a Unified Dashboard Is Necessary
A modern smart home has devices across multiple ecosystems — Zigbee sensors, Wi-Fi devices, Z-Wave panels, IP cameras — each with its own app. Switching between 5–6 apps to check home status is not true smart living. A unified dashboard brings everything together in one place.
MQTT Broker: Mosquitto
Mosquitto is the standard open-source MQTT broker, running in Docker on a Raspberry Pi or home server. Example MQTT topics: home/alarm/zone1 (motion sensor), home/air/pm25 (PM2.5 reading), home/elderly/bedroom/presence (radar presence), home/energy/main/power (total power kW), home/water/kitchen/leak (flood sensor).
Retain flag: use MQTT retain for data that should always show the latest value — new subscribers receive the last known state immediately on subscribe.
QoS level: QoS 1 (At Least Once) for alarm alerts; QoS 0 (At Most Once) for frequently-updating sensor telemetry.
Node-RED: Data Flow Orchestrator
Node-RED is a visual programming environment suited to IoT data flows. Example flows: PM2.5 MQTT → transform (μg/m³ to AQI) → publish AQI + write to InfluxDB; alarm trigger → email + SMS + LINE + HA call service → log to InfluxDB; elderly presence timeout (>6 hours in room) → check vitals → if anomaly → alert; energy exceeds threshold → turn off non-essential devices → log event.
Node-RED Dashboard: the built-in dashboard UI (node-red-dashboard or node-red-contrib-ui-iro) handles simple monitoring without needing Grafana.
InfluxDB: Time-Series Database
InfluxDB is ideal for IoT telemetry time series. Structure: Measurement (sensor name: pm25, temperature, power); Tags (room name, device ID — indexed for fast queries); Fields (actual sensor values as float); Timestamp (automatic).
Retention policy: raw 1-second/1-minute data retained for 7 days → 1-hour aggregates for 1 year → 1-day aggregates for 5 years. This controls database size on the Pi’s SD card.
Grafana: Unified Dashboard Visualisation
Grafana connects to InfluxDB and renders professional dashboards. Recommended panels: current PM2.5/AQI (gauge + 24h history); alarm zone status (table: zone, status, last triggered); energy usage live kW + daily kWh + cost estimate; elderly presence map (floor plan overlay if using the plugin); temperature/humidity per room (time series); water leak status (binary: safe/alert).
Grafana alerts: configure alert rules in Grafana to notify LINE/email when values exceed thresholds — operates independently of HA automations, preventing a single point of failure.
Home Assistant Integration
HA integrates Grafana panels as Lovelace cards via the Grafana Panel integration — users see everything in the HA app without opening Grafana separately.
Full Stack on Raspberry Pi 5
Deploy all services via Docker Compose: Mosquitto (port 1883), Node-RED (port 1880), InfluxDB (port 8086), Grafana (port 3000), Home Assistant (port 8123). RAM requirement: ~2–3GB for all services — Pi 5 8GB handles this comfortably. An SSD is recommended over SD card for InfluxDB’s frequent writes.