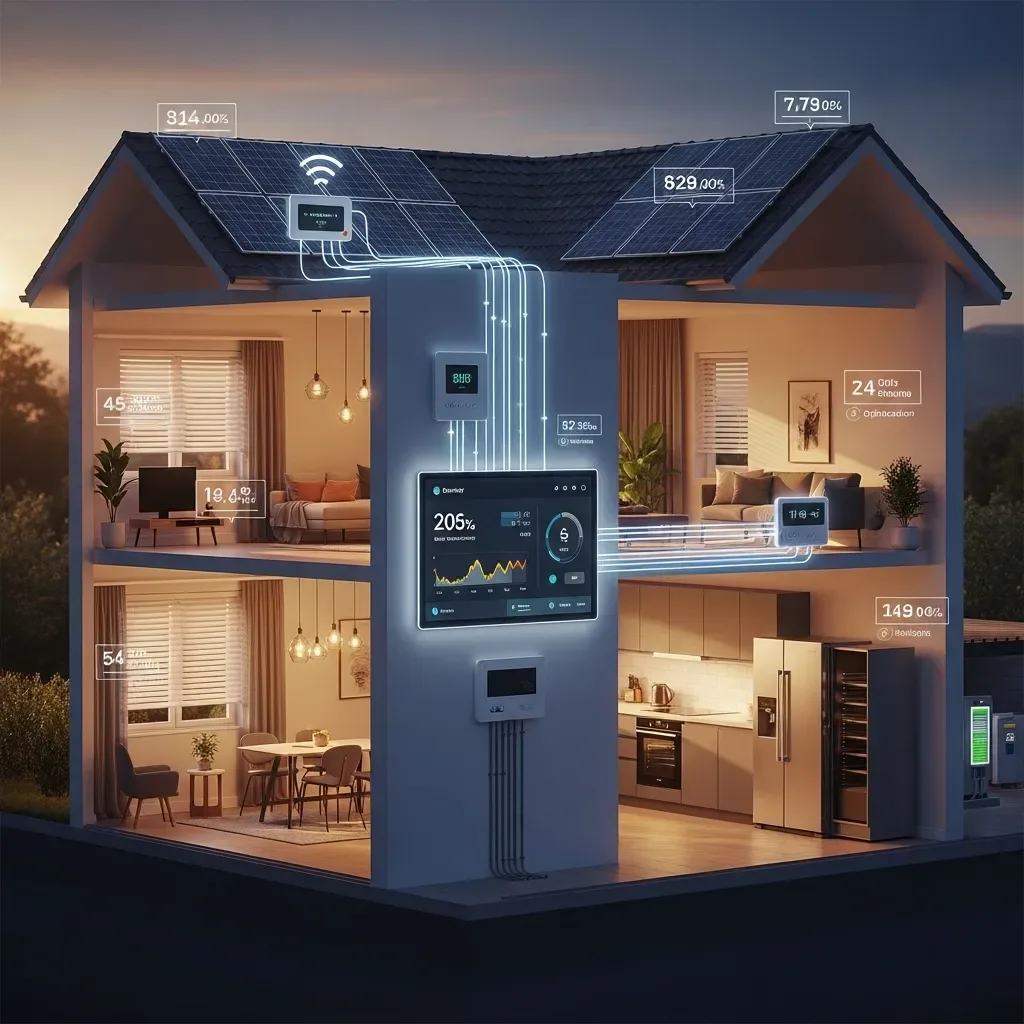
Why Traditional Energy Management Falls Short
Most Thai households have no idea whether their electricity bill is above or below average for a home their size, and no visibility into which appliances consume the most power. Traditional meters report only a monthly total — providing no actionable information about where waste occurs. Smart Home changes this by delivering appliance-level and circuit-level data, making energy savings evidence-based and measurable rather than intuitive guesswork.
Energy Dashboard: Power Data That Anyone Can Act On
HappySmart’s Energy Dashboard presents consumption data in formats understandable without an engineering background: hourly usage graphs over 30 days, the five highest-consuming appliances ranked by cost, current-month comparison against the previous week and the same month last year, and an end-of-month bill projection based on current behavior. Every household member immediately sees the financial impact of behavioral changes — for example, how much running the AC one hour less per day saves monthly.
Appliance Scheduler: Running High-Draw Devices at the Right Rate
For homes on MEA Time-of-Use (TOU) metering — with Peak rates of ฿4.18/unit (09:00–22:00) and Off-Peak rates of ฿2.60/unit (22:00–09:00) — HappySmart’s Appliance Scheduler automatically shifts high-draw appliance operation to Off-Peak windows. The washing machine starts at 22:00 instead of 16:00. The dishwasher runs at midnight. The water heater reserve charges at 02:00. All of this happens automatically with no need to manually remember or set individual timers.
AI Load Optimizer: Intelligent Distribution Across Time and Tariff
HappySmart’s AI Load Optimizer operates at two levels: Intra-home optimization staggers high-draw device startups to prevent simultaneous Peak Demand that could trip circuit breakers; MEA Rate optimization shifts deferrable loads to Off-Peak windows to reduce per-unit cost. The system also tracks Demand Charge exposure for homes subject to peak demand billing, sending LINE alerts when approaching charge thresholds before costs escalate.
Long-Term Savings: Payback and Continuous Return
Analysis of HappySmart users in Bangkok shows that a complete Automated Energy Management deployment reduces electricity bills by 20–30% monthly when all features are active. For a home with a ฿4,500 monthly bill, this means saving ฿900–1,350 per month, or ฿10,800–16,200 annually. Full 3-bedroom installation costs ฿25,000–40,000, yielding ROI payback in 2–4 years and continuous savings across the system’s 8–10 year operational life — making this one of the highest-ROI home technology investments available.
Carbon Footprint Tracking: Saving Energy as Environmental Action
HappySmart’s Energy Dashboard displays CO2 reduction achieved through energy savings, calculated using MEA’s published emission factor (0.4999 kgCO2e/kWh for 2024). Environmentally conscious families see concrete impact alongside financial savings — for example, reducing consumption by 200 units monthly is equivalent to planting 3 trees per year. This dimension of visibility provides motivation to save energy that extends beyond purely financial considerations.